Electric Field Amplitude and Intensity Distribution Diagram
Description
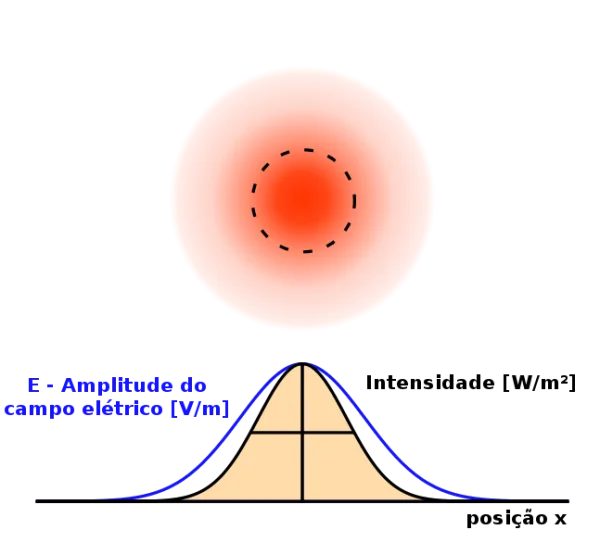
This image displays a diagram illustrating the amplitude and intensity distribution of an electric field. It features a radial intensity plot at the top and a Gaussian-like curve depicting the electric field amplitude at the bottom, useful for educational materials or scientific presentations.
PNG keywords
PNG info
Dimensions
647x599px
Filesize
44.82KB
MIME type
Image/png
Resize PNG
width(px)
height(px)
Relevant png images
Student Attendance Management System UI
1391x610px
74.92KB
Cartoon Bookshelf with Books PNG Transparent Background
1266x2304px
111.73KB
Buckle Up Drive Safely Icon PNG Transparent Background
800x800px
141.73KB
Tut Wuri Handayani Logo PNG Transparent Background
1200x630px
207.51KB
Tut Wuri Handayani Logo PNG Transparent Background
475x480px
71.52KB
Combustion Zone Diagram Transparent Background
2730x990px
173.84KB
Common Laboratory Equipment Diagram Silhouette PNG
736x943px
652.34KB
The Lab Creative Science Technology Concept Icon
460x266px
23.93KB
Cartoon Computer Reading Book with Plug PNG
1255x1025px
804.32KB
Cartoon Lightbulb Idea PNG
749x805px
18.77KB
Lightbulb Idea Icon PNG Transparent Background
709x800px
28.64KB
Laboratory Test Tubes and Flask PNG Transparent Background
400x400px
66.53KB