Building HVAC Simulation Velocity and Temperature PNG
Description
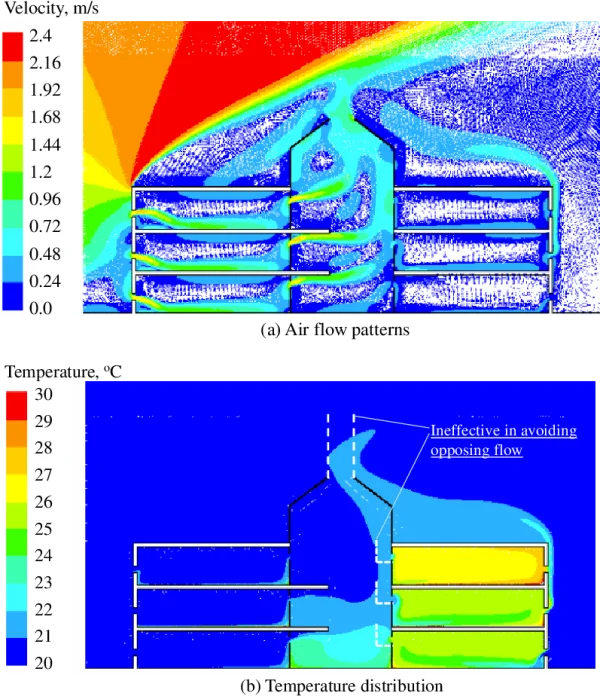
This PNG features two computational fluid dynamics (CFD) plots depicting velocity and temperature distributions within a multi-level building structure. It illustrates air flow patterns and thermal zones, highlighting areas of high velocity and ineffective opposing flow for HVAC system analysis.
PNG keywords
PNG info
Dimensions
797x924px
Filesize
202.51KB
MIME type
Image/png
Resize PNG
width(px)
height(px)
Relevant png images
Electric Field Amplitude and Intensity Distribution Diagram
647x599px
44.82KB
Cartoon Green Monster Virus PNG Transparent Background
650x644px
298.28KB
Human Lungs Anatomy PNG Transparent Background
650x569px
81.3KB
Blue Range Bar Chart PNG
1375x1013px
12.56KB
Blue Science Flask PNG Transparent Background
999x999px
132.79KB
Astronaut Helmet Icon PNG Transparent Background
512x512px
47.59KB
Pressure Gauge Internal Mechanism Diagram PNG
1200x1268px
254.54KB
Laboratory Flasks with Blue and Green Liquid PNG
960x495px
34.04KB
Red Capsule Shape with White Particles PNG
652x688px
241.58KB
Radiation Hazard Capsules PNG Transparent Background
768x576px
374.29KB
Air Conditioner Split System PNG Transparent
2900x2200px
495.45KB
Blue Chemical Flask with Liquid PNG Transparent
256x256px
49.84KB